Authors :
* P.Amireault, * M.Dussiot, N.Marpaux**, A.Lagrange***, Q. Brebant***
*INSERM, France, **EFS Bourgogne Franche Comté, Besançon, France, ***MacoPharma, Tourcoing, France
Introduction
Storage of red cell concentrates (RCCs) requires compliance with certain standards, including hematocrit levels (Ht). Storage quality of red blood cells (RBCs) depends on the storage solution and remains a matter of concern since the proportion of transfused RBCs remaining in circulation 24h after transfusion decreases along storage.
This technically challenging and costly in vivo measure of transfusion efficacy can be estimated by in vitro quantification of a morphologically-altered RBC subset named Storage-induced Micro-Erythrocytes (SMEs).
Previous observations at Macopharma and at NetCadCanadian Blood Services indicated Ht discrepancies across measurement methods (microcapillary vs. hematology analyzers), especially for RCCs stored inPAGGSM solution, necessitating further investigation.
Aim
The main objective was to measure and compare Ht levels for RCCs stored in SAGM and PAGGSM, focusing on measurement discrepancies between microcapillary methods (HT200) and various hematology analyzers.
Our secondary objective was to quantify SMEs in these 2 storage solutions, allowing to compare their impact on RCC storage quality.
Method
16 whole blood bags were processed via pool and split methods at EFS Besançon. Eight paired SAGM and PAGGSM RCCs were thus evaluated at day 1(D1), D7, D21, and D42 of storage using HT200 and hematology analyzers (HORIBA ABX ES60 and YUMIZEN, SYSMEX XN1000 and XNL).
Measurements included Ht and hemolysis. Imaging Flow cytometry (IFC) was used to quantify SMEs and RBC projected surface area.
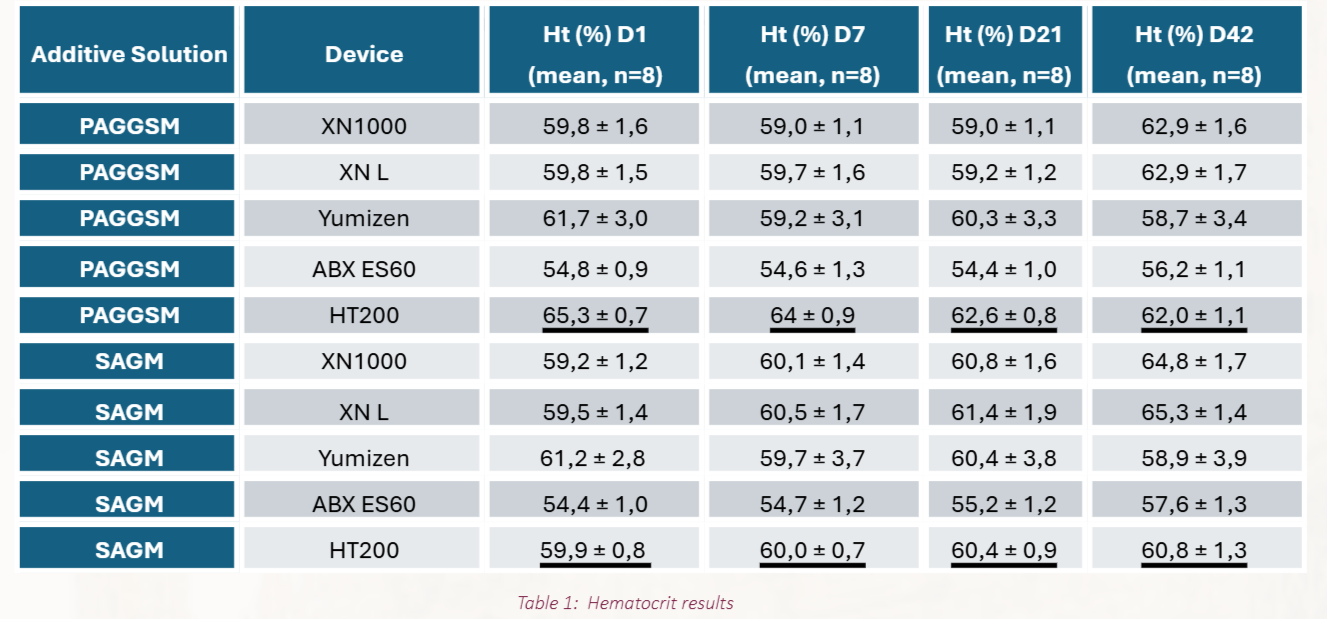
Results
SAGM and PAGGSM showed distinct behaviors over the RCCs storage period.
At D1 in PAGGSM, the microcapillary method (HT200) consistently provided the highest Ht values and was used as the reference standard. Hematology analyzers underestimated Ht to varying degrees: ABX ES60 (10%), YUMIZEN (3.6%),and both Sysmex (5.5%).
At D1 in SAGM, the results were much more similar between the microcapillary method and the hematology analyzers, except for ABX ES60 that underestimated the value by 5%. Over time, PAGGSM showed a linear decline in Ht for the microcapillary method (from 65% at D1 to 62% at D42), in line with the observed decrease in projected surface area observed by IFC (from 72,5µm² at D1 to 65,8µm² at D42).
Conversely, SAGM maintained more stable Ht values (and projected surface area), possibly due to its hypertonicity. The differences between the microcapillary method and hematology analyzers are from the analyzers diluting the RCC sample with hypertonic reagents, causing RBC shrinkage before measurement.
Hemolysis was impacted by the Ht measurement with a higher hemolysis in ABX ES60 compared to microcapillary method (+0,07% at D42 in PAGGSM). The surface area projected at D1 and during storage is higher in PAGGSM (D42, SAGM: 63.1µm² vs D42, PAGGSM: 65,8µm²) confirming the hypertonic effect of SAGM. SMEs accumulated along storage in SAGM and PAGGSM.
The proportion of SMEs at d42 was lower in PAGGSM (34.7%) than in SAGM (46.3%), suggesting that PAGGSM better maintains the RBC circulation capacity after transfusion.
Conclusions
Storage solution significantly impacts RCC storage quality. PAGGSM outperformed SAGM in preserving RBC morphology and minimizing SMEs formation, essential for transfusion efficacy.
Methodological differences highlight the need for standardization in Ht measurement especially in PAGGSM.
Acknowledgement
Study performed in collaboration with EFS Besançon.
Macopharma kits (FQE610A & FQE741C) were used.
References
Zehnder L., Schulzki T., Goede J.S., Hayes J., Reinhart W.H.: Erythrocyte storage in hypertonic (SAGM) or isotonic (PAGGSM)conservation medium: influence on cell properties. Vox Sanguinis 2008, 95, 280–287
Discover more about our DEHT PAGGSM solution : Discover Innovations – At Macopharma, we believe in innovation !